China PU Leather Exports to Vietnam: Market Data 2017–2025
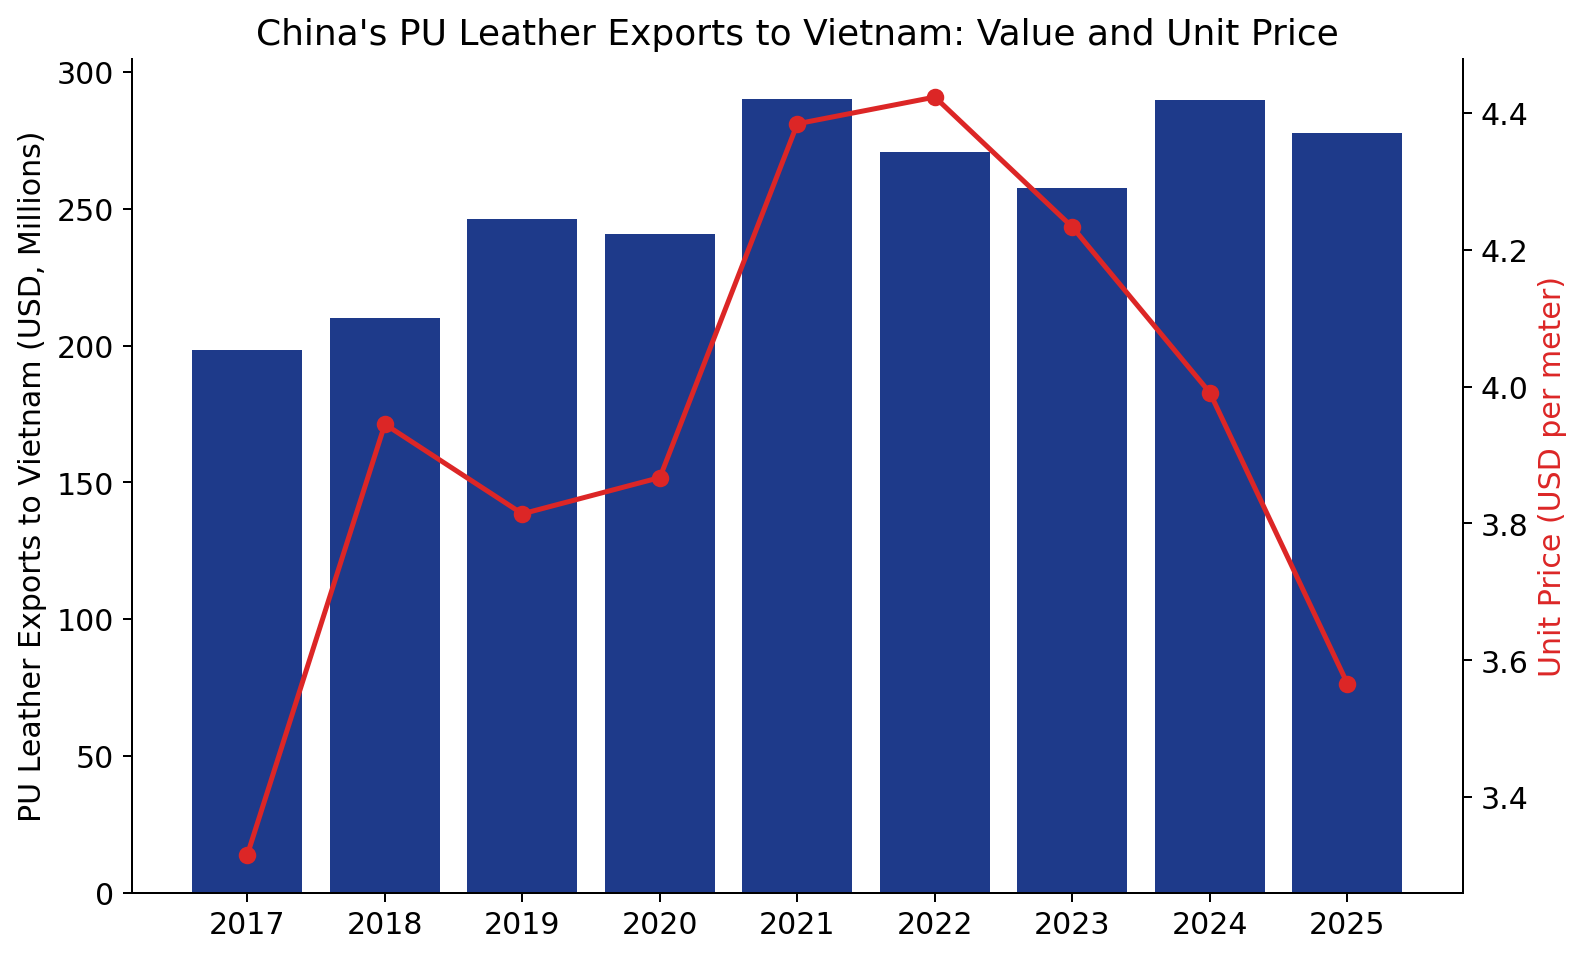
Vietnam was the largest destination for China's PU synthetic leather exports in every year from 2017 to 2025. It imported about $278 million in 2025, roughly 18% of China's PU leather exports, with record volume of 77.9 million meters while unit prices fell about 19% from their 2022 peak to $3.57 per meter.
Published 2026-10-09
Vietnam is the single most important destination for Chinese PU synthetic leather. This report breaks down the trade between the two countries using official Chinese customs export data, to give buyers, suppliers, and analysts a concrete view of the market’s size, pricing, supply sources, and timing. It is a country-level companion to our China PU Leather Export Trade Report.
Data Source & Method
Figures are from China’s customs export statistics under HS code 59032020 (PU-impregnated, coated, or laminated artificial leather), 2017 to June 2026. Full-year figures run 2017–2025; 2026 is first-half only and is not compared with full years. Comparisons with PVC leather (HS 59031020) and other plastic-coated leather (HS 59039020) use a fixed 1 USD = 7 CNY conversion for order-of-magnitude comparison.
Important: these are China’s export figures to Vietnam, not Vietnam’s own import statistics. The two can differ because of timing, valuation, transshipment, and classification.
Key Findings
- #1 destination every year: Vietnam ranked first among all destinations for China’s PU leather exports in each year from 2017 to 2025
- About $278M in 2025, up about 40% from $198M in 2017
- Volume at a record: 77.9 million meters in 2025, up about 30% from 59.8 million in 2017
- Unit price down ~19% from the 2022 peak, to $3.57 per meter in 2025
- Share of China’s PU exports: about 18.4% in 2025, up from 13.5% in 2017
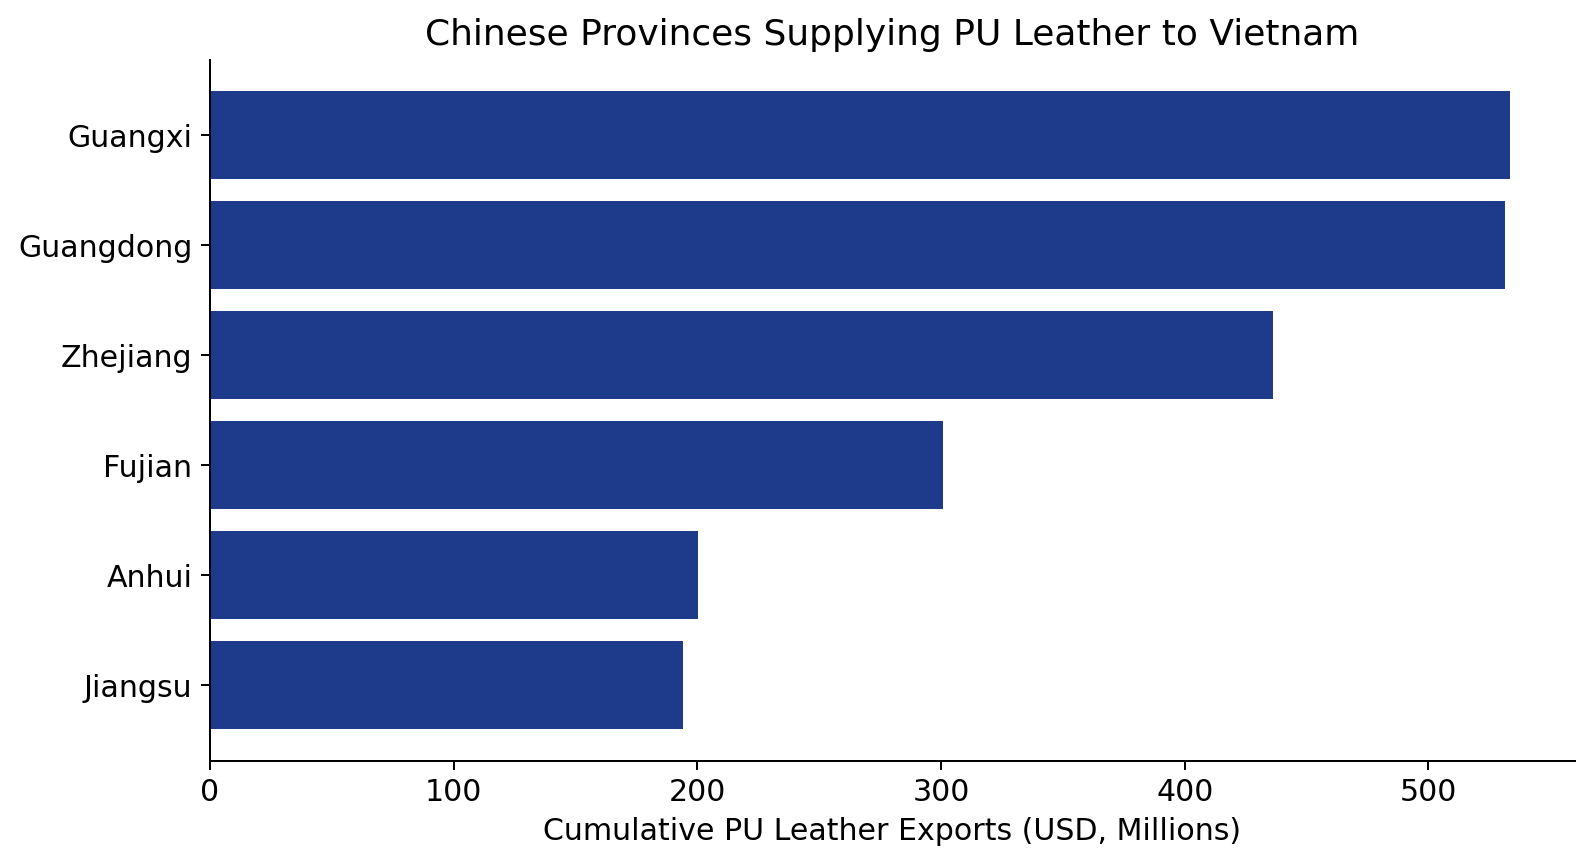
- Supply sources are shifting: Guangxi’s share fell from 37% to 11%, while Anhui, Fujian, Zhejiang and Guangdong gained
Annual Exports to Vietnam
| Year | Value (USD) | Length (m) | YoY | Unit price (USD/m) | Share of China’s PU exports |
|---|---|---|---|---|---|
| 2017 | $198.4M | 59.8M | — | 3.32 | 13.5% |
| 2018 | $210.2M | 53.3M | +5.9% | 3.95 | 14.6% |
| 2019 | $246.2M | 64.6M | +17.1% | 3.81 | 17.1% |
| 2020 | $240.6M | 62.2M | -2.2% | 3.87 | 21.0% |
| 2021 | $290.2M | 66.2M | +20.6% | 4.38 | 17.3% |
| 2022 | $270.6M | 61.2M | -6.8% | 4.42 | 15.0% |
| 2023 | $257.6M | 60.9M | -4.8% | 4.23 | 16.0% |
| 2024 | $289.9M | 72.6M | +12.5% | 3.99 | 18.6% |
| 2025 | $277.8M | 77.9M | -4.2% | 3.57 | 18.4% |
Vietnam’s share of China’s PU exports peaked at 21.0% in 2020. Since 2019, annual value has stayed in a band of roughly $240–290 million, but the mix has changed: between 2022 and 2025 volume rose from 61.2 to 77.9 million meters while total value stayed about the same, so Vietnam is buying more meters at a lower price per meter. Even so, Vietnam’s 2025 unit price of $3.57 per meter is well above the $2.28 per meter average across all destinations that year, which suggests a mid-to-higher grade product mix than the global average.
PU vs. PVC in the Vietnam Market
PU leather accounts for roughly three-quarters of China’s plastic-coated synthetic leather exports to Vietnam (75.7% in 2025), compared with about 21.7% for PVC and 2.6% for other plastic coated types. That is a higher PU share than the national average of about 68% in 2025, meaning Vietnamese buyers lean even more toward PU than the overall export market.
| Year | PU | PVC | Other plastic-coated |
|---|---|---|---|
| 2017 | 73.1% | 25.9% | 1.0% |
| 2020 | 75.9% | 21.7% | 2.4% |
| 2022 | 75.6% | 21.5% | 2.8% |
| 2025 | 75.7% | 21.7% | 2.6% |
For how the two materials differ, see PU vs PVC Leather.
Which Chinese Provinces Supply Vietnam?
| Province | Cumulative share | 2017 share | 2025 share |
|---|---|---|---|
| Guangxi | 21.9% | 37.2% | 10.7% |
| Guangdong | 21.9% | 19.6% | 24.0% |
| Zhejiang | 18.0% | 15.0% | 19.4% |
| Fujian | 12.4% | 9.9% | 14.9% |
| Anhui | 8.2% | 3.2% | 13.3% |
| Jiangsu | 8.0% | 10.5% | 7.8% |
The supply base has shifted away from Guangxi, the province that borders Vietnam and led in 2017, toward Guangdong, Zhejiang, Fujian and especially Anhui, whose share more than quadrupled. Guangxi’s early lead is consistent with its border location, but the data alone doesn’t explain why the mix moved, so treat any single-cause story with caution.
How the Trade Is Conducted
Over the full period, general trade accounts for 68.8% of PU leather exports to Vietnam by value, border small-scale trade for 21.1%, and processing trade with imported materials for 6.3%. The sizeable border trade share is consistent with the land border between the two countries.
Seasonality: When Do Shipments Peak?
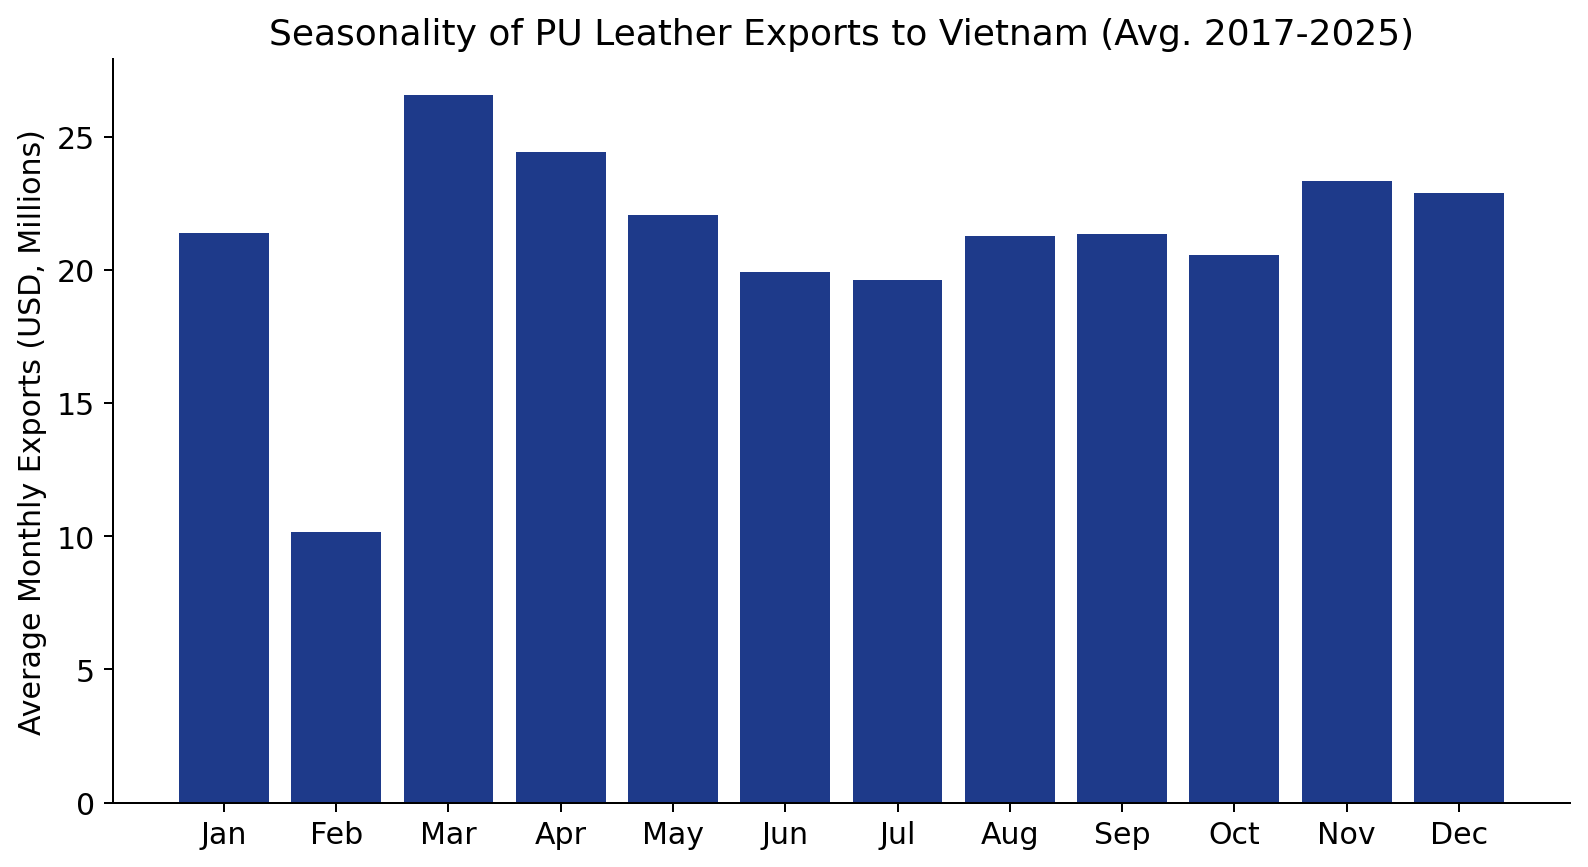
Average monthly exports to Vietnam (2017–2025) are lowest in February (about $10M) and highest in March (about $27M). January ($21M) is already strong, with a slowdown in February that lines up with the Lunar New Year holidays in both countries, followed by a rebound in March. Other months sit in a fairly even $20–24 million range. For buyers, this suggests placing orders before the new-year slowdown and expecting delays around the holiday.
What This Means for Buyers and Suppliers
- Footwear and garment manufacturing drives demand. Vietnam is one of the world’s major footwear producers, which fits the scale of its synthetic leather imports. See our guide to synthetic leather for footwear.
- Price benchmarks. A unit price around $3.5–4.4 per meter has been typical for Vietnam over the period, and the recent decline reflects market-wide price pressure rather than a collapse in demand.
- Supply is diverse. Several provinces compete for Vietnamese buyers, so supplier choice is broad, and quality and reliability matter more than location alone.
- Plan around February. Production and shipping calendars slow around the Lunar New Year.
Looking for PU, microfiber, or semi-PU leather for your product? See our PU leather range or contact us.
Source: China customs export data, HS 59032020 (PU), 59031020 (PVC), 59039020 (other plastic-coated), 2017–2025, independently processed and analyzed. Last updated October 2026.