China PU Leather Export Trade Report (2017–2025)
China's PU synthetic leather exports totaled roughly $15.1 billion in 2025, down from a 2022 peak of $1.81 billion annually as unit prices fell about 19%. Vietnam, India, and Mexico are the largest destination markets by value, while Myanmar (+661%) and Cambodia (+420%) were the fastest-growing markets by value between 2017 and 2025.
Published 2026-09-19
Most synthetic leather supplier websites describe their products in generic marketing language and leave pricing, trade volume, and market structure undisclosed. This report is built entirely from official Chinese customs export data and is, to our knowledge, the only publicly available breakdown of the global PU leather trade at this level of detail.
Data Source & Methodology
All figures below come from China’s official customs export statistics under HS code 59032020 (“polyurethane-impregnated, coated, or laminated artificial leather,” i.e. PU synthetic leather), covering 61,561 individual export records from January 2017 through June 2026 (H1). Figures for 2026 reflect only the first half of the year and are not directly comparable to full-year totals. Comparisons against PVC leather (HS 59031020) and other plastic-coated leather (HS 59039020) use a fixed 1 USD = 7 CNY conversion for order-of-magnitude comparison only, not precise year-by-year exchange rates.
Overall Market Size & Trend
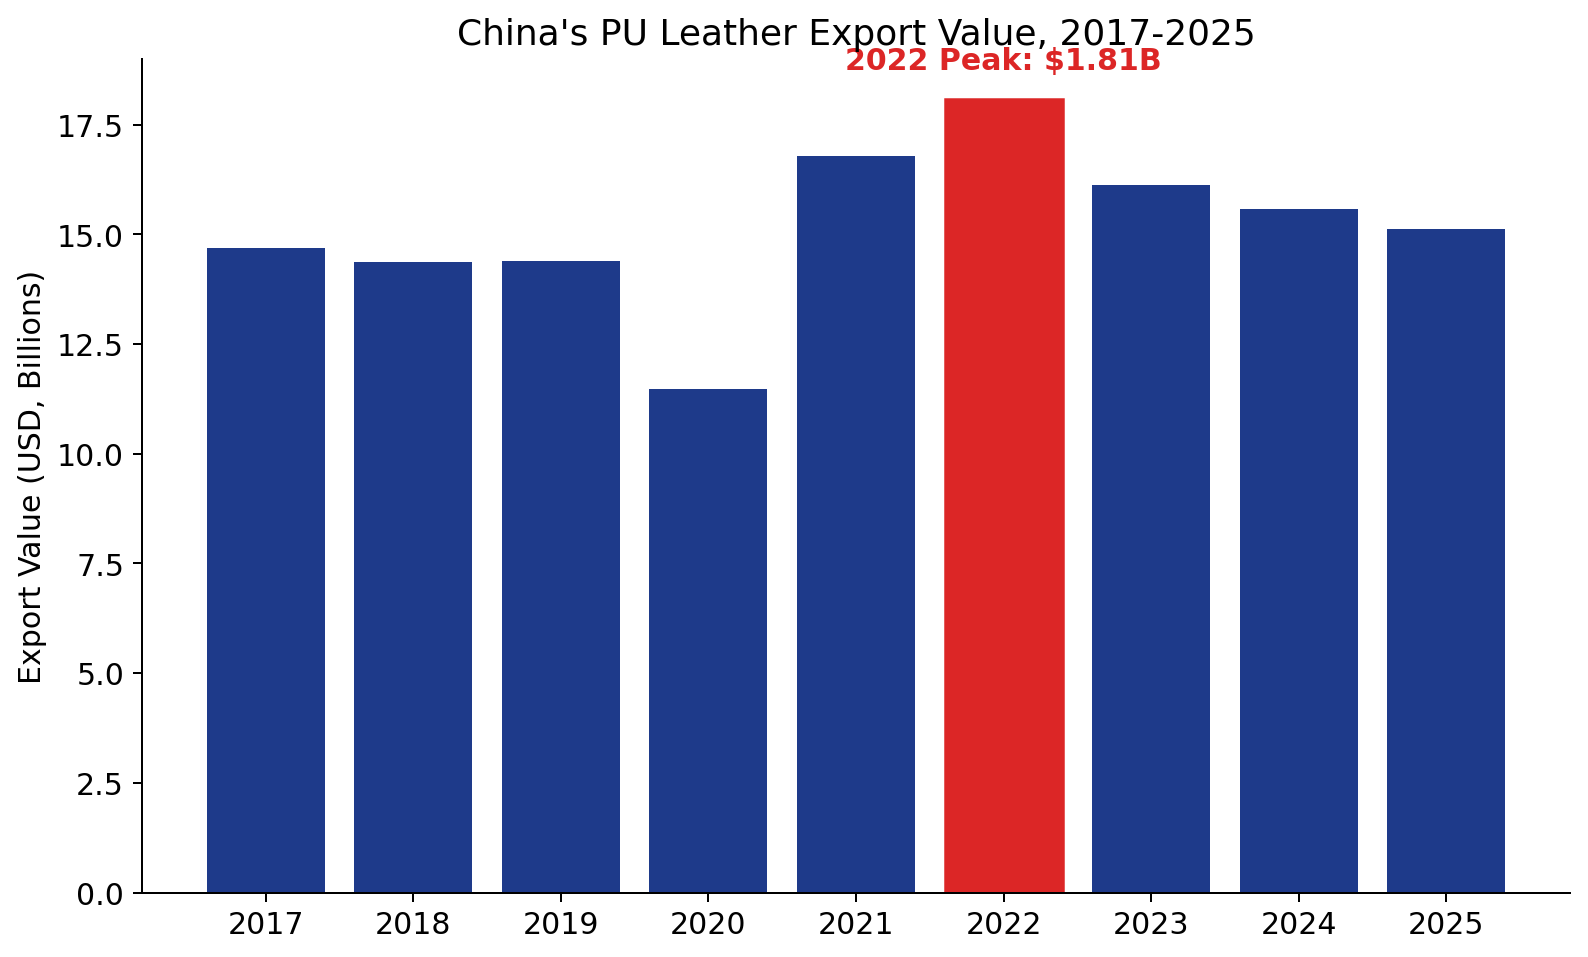
| Year | Export Value (USD) | Weight (kg) | Length (meters) | YoY |
|---|---|---|---|---|
| 2017 | $1.47B | 337.0M | 593.9M | — |
| 2018 | $1.44B | 318.7M | 551.7M | -2.2% |
| 2019 | $1.44B | 330.5M | 570.6M | +0.2% |
| 2020 | $1.15B | 242.1M | 426.1M | -20.2% (COVID) |
| 2021 | $1.68B | 333.8M | 599.3M | +46.2% (rebound) |
| 2022 | $1.81B | 354.1M | 640.2M | +7.7% (peak) |
| 2023 | $1.61B | 348.3M | 626.7M | -10.8% |
| 2024 | $1.56B | 347.2M | 620.2M | -3.5% |
| 2025 | $1.51B | 369.0M | 662.8M | -2.9% |
| 2026 H1 | $0.79B | 187.0M | 338.3M | (half-year only) |
Export value peaked in 2022 at $1.81 billion and has declined for three consecutive years to $1.51 billion in 2025 — but export volume (length in meters) actually hit a new high in 2025. This is a “volume up, value down” pattern, meaning the market is not shrinking in real terms; it is going through intense price competition.
Price Trend: Unit Prices Down ~19% Since the 2022 Peak
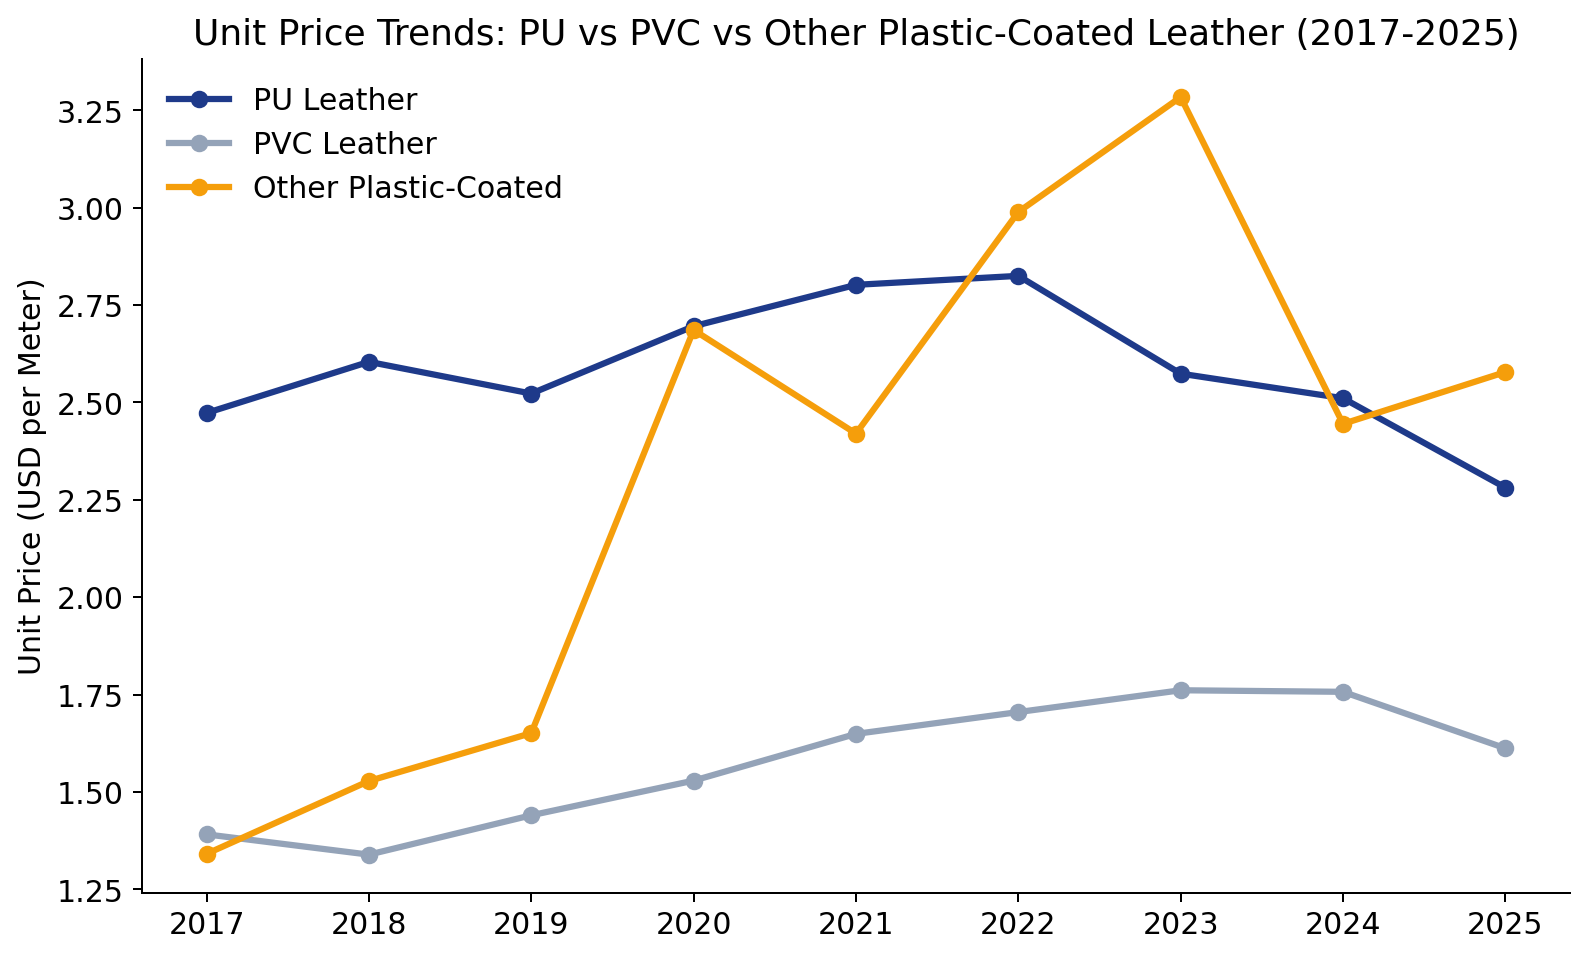
| Year | USD / kg | USD / meter |
|---|---|---|
| 2017 | 4.358 | 2.473 |
| 2022 | 5.108 | 2.825 (peak) |
| 2023 | 4.630 | 2.574 |
| 2024 | 4.484 | 2.511 |
| 2025 | 4.097 | 2.281 |
| 2026 H1 | 4.250 | 2.350 |
Unit price fell from a 2022 peak of $2.825/meter to $2.281/meter in 2025 — a decline of roughly 19%. This is a concrete, citable price benchmark that most supplier websites in this industry do not publish.
Top Destination Countries (Cumulative 2017–2026 H1)
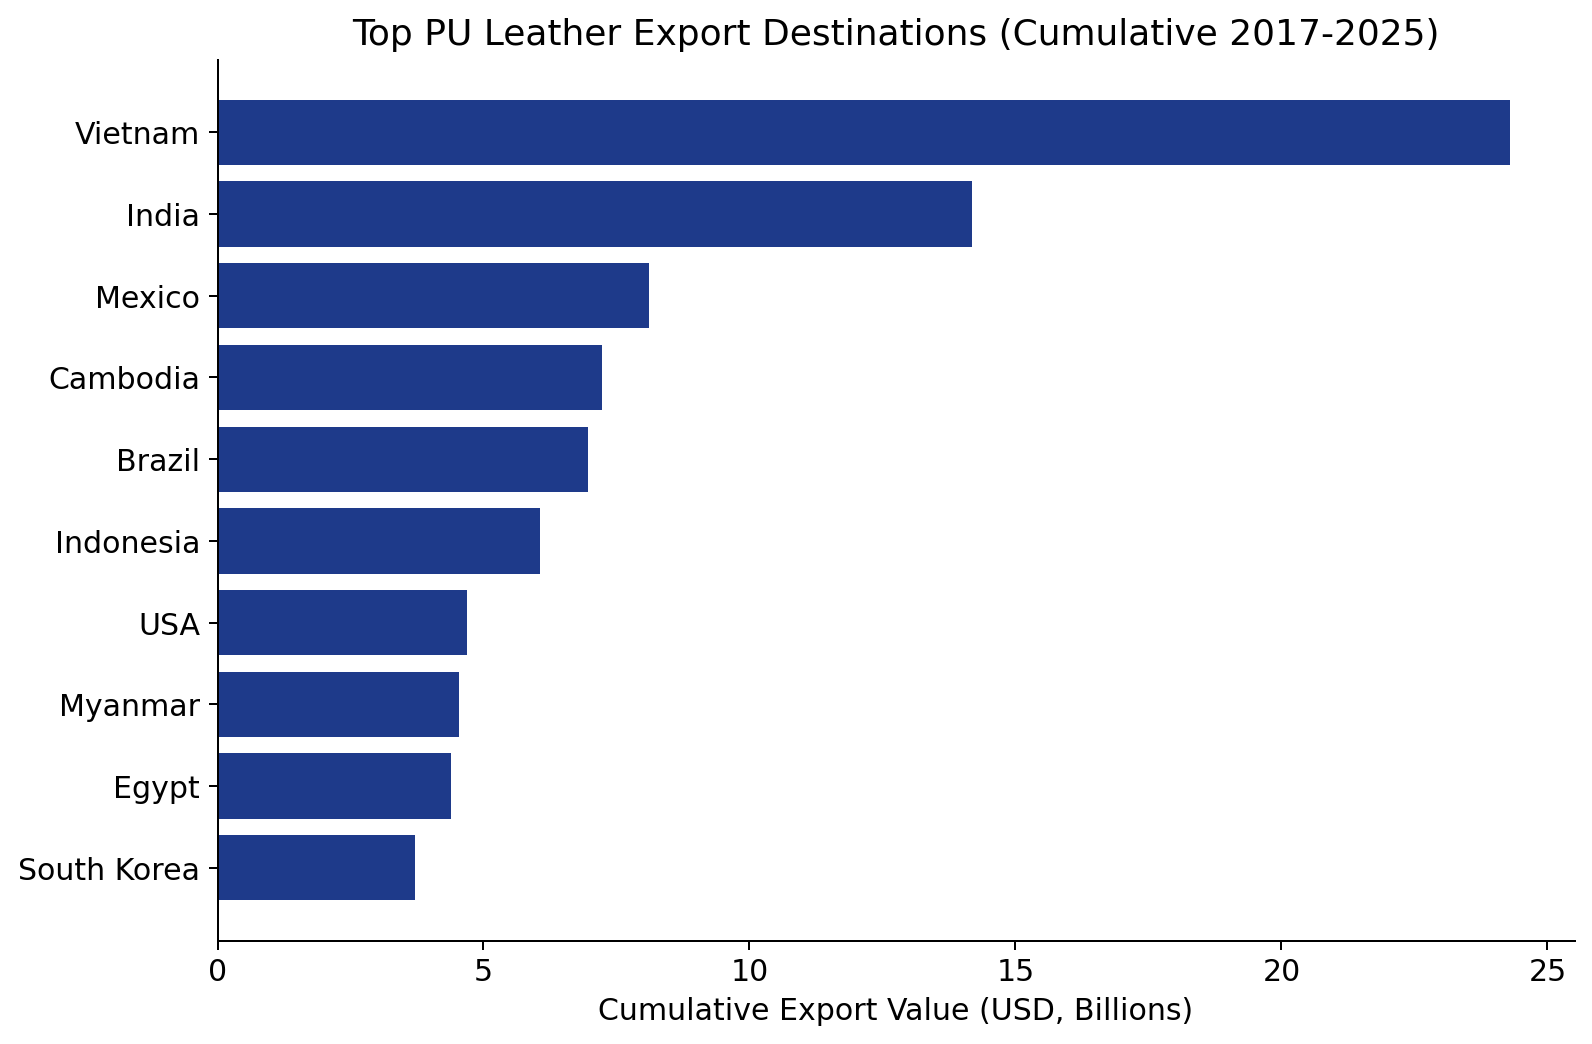
| Rank | Country | Cumulative Value (USD) |
|---|---|---|
| 1 | Vietnam | $2.43B |
| 2 | India | $1.42B |
| 3 | Mexico | $0.81B |
| 4 | Cambodia | $0.72B |
| 5 | Brazil | $0.70B |
| 6 | Indonesia | $0.61B |
| 7 | United States | $0.47B |
| 8 | Myanmar | $0.45B |
| 9 | Egypt | $0.44B |
| 10 | South Korea | $0.37B |
Top buyers cluster around two industrial bases: Southeast/South Asian footwear and garment manufacturing (Vietnam, Cambodia, Indonesia, Myanmar, Bangladesh) and automotive manufacturing (Mexico, Brazil) — consistent with footwear and automotive interiors being the two most frequently cited application categories across the industry’s competitor websites.
Fastest-Growing & Fastest-Shrinking Markets (2017 vs. 2025)
Cumulative rankings hide the more useful story: who is growing and who is shrinking. Comparing each top-10 destination’s 2017 value against 2025:
| Country | 2017 (USD) | 2025 (USD) | Change |
|---|---|---|---|
| Myanmar | $5.9M | $44.8M | +661% |
| Cambodia | $21.6M | $112.3M | +420% |
| Indonesia | $39.1M | $79.7M | +104% |
| Egypt | $36.6M | $58.2M | +59% |
| Vietnam | $198.4M | $277.8M | +40% |
| Mexico | $86.9M | $81.4M | -6% |
| Brazil | $76.3M | $71.1M | -7% |
| India | $173.0M | $144.2M | -17% |
| South Korea | $46.0M | $35.6M | -23% |
| United States | $79.1M | $27.2M | -66% |
Myanmar and Cambodia are, by a wide margin, the fastest-growing PU leather import markets — both are also the fastest-growing markets for PVC and other plastic-coated leather in the same period, indicating a broader shift of footwear/garment manufacturing capacity into these countries rather than a PU-specific phenomenon. US imports of Chinese PU leather fell 66% from 2017 to 2025 — the steepest decline of any top-10 market.
Unit Price by Destination Country: Who Buys the Premium Grades?
A country’s total import value doesn’t tell you what grade of material it’s buying. Comparing cumulative value against cumulative length by country reveals real differences in product tier:
| Country | Unit Price (USD/meter) |
|---|---|
| United States | $4.09 (highest) |
| Vietnam | $3.93 |
| Indonesia | $3.73 |
| Cambodia | $3.69 |
| Italy | $3.28 |
| South Korea | $3.13 |
| Myanmar | $3.01 |
| Mexico | $2.31 |
| Bangladesh | $2.16 |
| Brazil | $1.95 |
| Egypt | $1.79 |
| India | $1.74 (lowest) |
Despite shrinking import volume, the United States pays the highest average unit price of any top-15 market — suggesting the demand that remains is concentrated in higher-grade material. India, despite being the second-largest market by cumulative value, has the lowest unit price of any top-15 market, consistent with high-volume, price-sensitive purchasing rather than premium positioning.
Export Province Landscape: Zhejiang Dominant but Losing Share
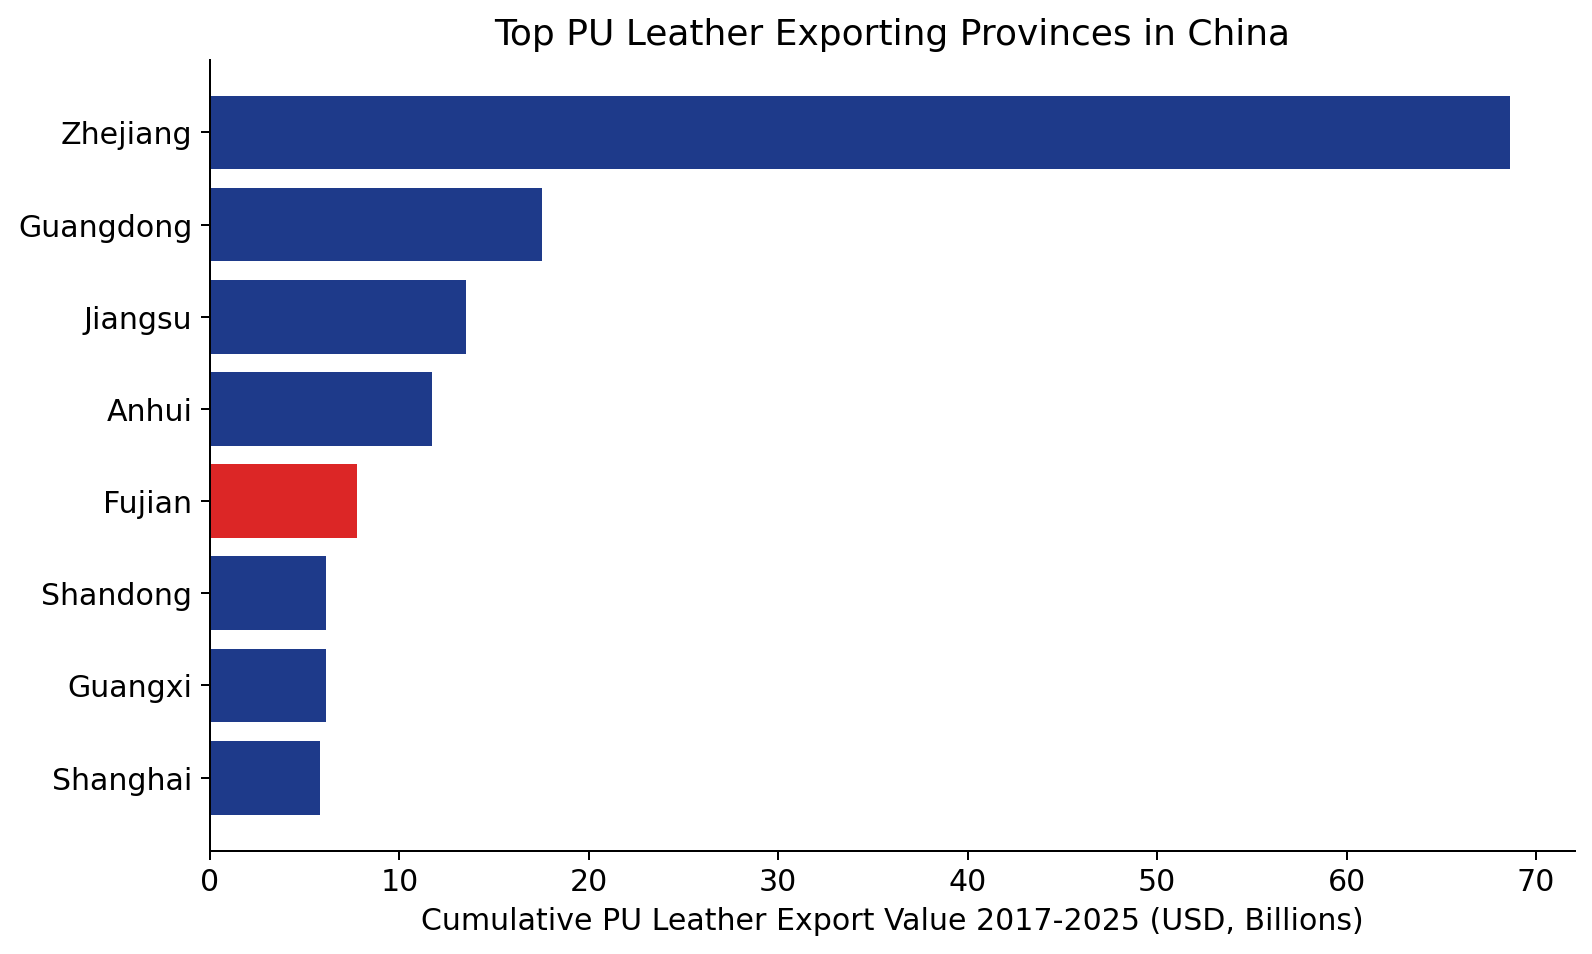
| Province | 2017 Share | 2025 Share | Trend |
|---|---|---|---|
| Zhejiang | 49.1% | 45.0% | Still #1 by a wide margin, but slowly losing share |
| Guangdong | 10.0% | 14.3% | Rising |
| Jiangsu | 9.7% | 9.2% | Roughly flat |
| Anhui | 7.8% | 8.0% | Roughly flat |
| Fujian | 6.8% | 6.0% | Slight decline |
| Shandong | 3.0% | 5.2% | Nearly doubled |
| Guangxi | 5.1% | 2.8% | Declining |
| Shanghai | 5.5% | 3.5% | Declining |
Zhejiang Province remains the dominant PU leather manufacturing base by a wide margin, though its share has eroded modestly since 2017 as Guangdong and Shandong gain ground.
PU vs. PVC vs. Other Plastic-Coated Leather: Market Share
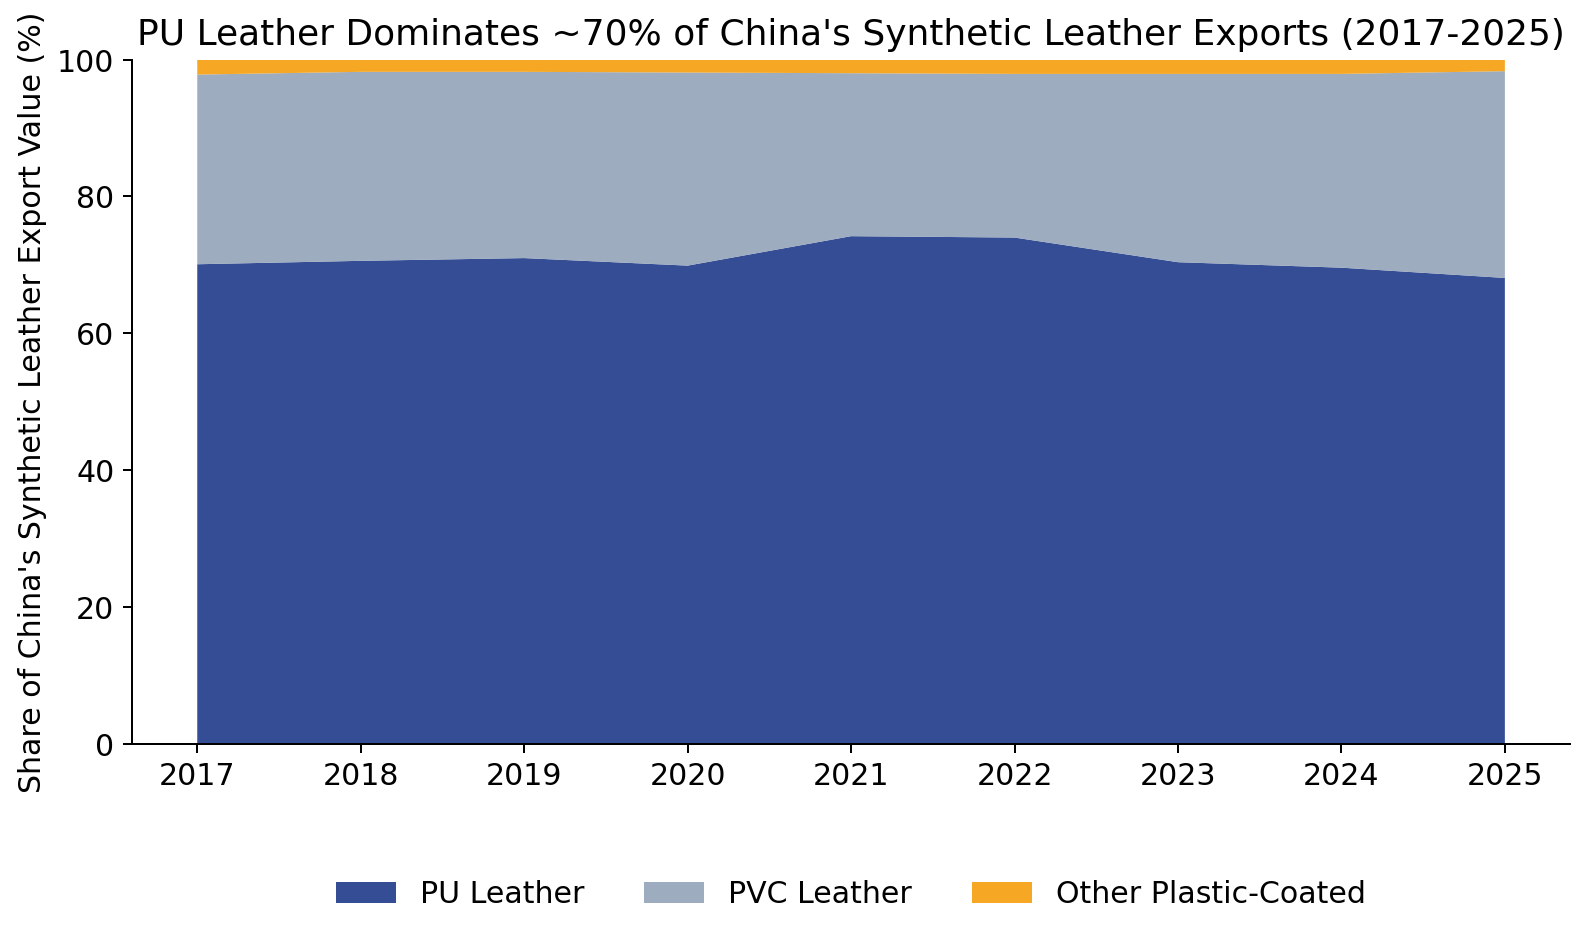
PU leather has consistently accounted for roughly 68%–74% of China’s total plastic-coated synthetic leather export value every year from 2017 through 2025 — more than double the combined share of PVC and all other plastic-coated leather materials. Full breakdown in our PU leather guide and PU vs. PVC comparison.
Key Takeaways
- The PU leather export market is not shrinking — it’s repricing. Volume hit a record high in 2025 while unit prices fell ~19% from their 2022 peak.
- Myanmar and Cambodia are the standout growth markets (+661% and +420% since 2017), part of a broader shift of footwear/garment manufacturing into Southeast Asia that shows up consistently across PU, PVC, and other plastic-coated leather categories.
- US demand for Chinese PU leather has fallen sharply (-66% since 2017) even as US buyers continue paying the highest unit prices of any major market — a shrinking but premium-skewed market.
- India is the inverse: a large, low-unit-price market driven by volume rather than premium positioning.
- Zhejiang Province remains the dominant manufacturing base, though Guangdong and Shandong are gaining share.
This report will be updated annually as new customs data becomes available. Last updated: September 2026, covering full-year data through 2025 and partial 2026 H1 data.